GPUbench is a benchmarking tool for testing of early OpenGL
accelerators. It is able to measure speed of rasterization (pixel
fill rate) and the speed of vertex/triangle processing (triangle
rate), both under different scenarios.
Changes: 2020-12-28 - More cards again! The oldest benchmarked systems
are now from 1992 (SGI "Entry" REX 1.5 and SGI XS24-Z... both in an
SGI Indigo workstation). Other cards include SiS 6326 and SGI Octane
MXE. 2020-10-02 - There are new cards including SGI Indy XL24 and
XZ (Elan) from 1994, Dynamic Pictures Oxygen 202/402, multiple
E&S REALimage chipsets and Rendition Vérité V2200 (one of the
cheap options to get full OpenGL in 1997). I've also added a modern
Intel integrated graphics for comparison. 2019-12-05 - More cards in the result table (including NEC,
Sun's Zulu...). New rows were added to show the performance hit
caused by enabling the Z-Buffer. Check the test description on the
result page (a small button called "Explanation+Computers"
at the bottom of the page) 2019-12-04 - New Sun/Solaris binaries were added. Copy the
binary you want to use from "_Solaris-binary" to the the
GPUbench root directory and be sure that it is renamed to "gpubench"
before a test script is run. 2019-04-07 - The source code is now compatible with older C
compilers. GCC is not required anymore (tested with SGI's MIPSpro). 2019-03-19 - GPUbench 1.1 released. This version is finally
able to properly test performance hit caused by Z-Buffer.
Windows: GPUbench relies on Win32 API and OpenGL 1.1. Thus,
it needs at least Windows 95 or Windows NT 4.0 when Microsoft’s
software renderer is involved. In case of hardware accelerated
OpenGL environment (ICD), GPUbench may also run on Windows NT 3.51
but this was not tested.
Windows 95 (pre-OSR2) doesn’t have opengl32.dll bundled with the
system so it must be downloaded from the Microsoft website in order
to meet the program’s requirements.
UNIX: The UNIX version requires the X11 graphical environment
and OpenGL libraries in the system. The provided binary works on
IRIX (tested on SGI O2 and SGI Octane2). HP-UX and Solaris
binaries are planned but I don’t have such systems now. Use the .sh
scripts instead of the .bat files to start the test.
The binary called 'gpubench_ogl1' can be used with IRIX systems
supporting only OpenGL 1.0 (IRIX 6.2 and older). This version does
not support texture mapping. I assume that it should not be an issue
because these older IRIX systems mostly don't support hardware
texturing.
UPDATE: 32bit and 64bit Sun binaries for version 1.0 are
available in the archive (thanks to Jan Šenolt).
Unpack \_Solaris-bin\bin.tgz and use the appropriate binary for
your system. I will add 1.2 binaries soon.
Download
GPUbench.zip / gpubench.tar.gz
– This archive contains the whole project including binary files,
the source code and collected benchmark results. Read the
license file (__LICENSE.TXT) before using the product!
The Windows version (gpubench.exe) is developed, tested and
compiled using Dev-C++ 4.9.9.3 (freeware). This version of Dev-C++
runs well on any Windows starting with Windows 95/NT4.
The IRIX version (gpubench) is compiled on SGI O2 using GCC.
Check makefile for available options. The program should be
also buildable on other UNIX systems with X11/Motif and OpenGL
support. Remove the ‘-DSGI’ option if your UNIX workstation
has support for the the GL_ARB_multitexture extension.
Usage
There are already predefined sets of tests to measure different
parameters of a graphics card. These sets can be run by starting one
of following batch files (under Windows):
f/w – Full-screen mode / windowed mode selection. GPUbench
cannot change a display mode by itself so it is necessary to
manually change a desktop resolution according to the size of the
program window. If f sets are started and a desktop
resolution matches the window size, GPUbench doesn’t draw window
decorations and fills the whole screen. Graphics drivers understand
this behavior as a full-screen program and can use the page flipping
feature (you might get slightly better results).
640/1024 – Defines a window size of the test. 640
means 640x480, 1024 means 1024x768. A desktop color depth is
used for the test and no change in configuration files should be
required. Please note that graphics cards cannot accelerate OpenGL
in all available color depths. 16- and 256-color modes usually don’t
work. Early consumer boards might not work in 32-bit modes (16
millions of colors).
If low is in the name of a set, a less demanding
configuration is used. This is helpful for many pre-1998 3D
accelerators and software renderers.
If high is in the name of a set, a more demanding
configuration is used. This allows to measure newer cards
(year 2000+) and the old cards that don’t allow to disable V-Sync.
An example video of 3Dfx Voodoo2 running the
'_All-Tests-f640low.bat':
Above tests produce results to following files (respectively):
There is also a log file where you can find standard OpenGL strings
(GL_VENDOR, GL_RENDERER, GL_VERSION and GL_EXTENSIONS):
gpubench.log
I just want to run it
The best way is to set the desktop resolution to 640x480 and
disable V-Sync (vertical synchronization). If you want to get
the best results out of a card, you should select the High Color
mode (65 thousands of colors, 16bit) in the color depth pull-down
menu. If you card supports also rendering in the True Color mode (16
millions of colors, 32bit), you can repeat the test and see the
difference in results. They are mostly caused by increased memory
bandwidth.
If the resolution and color depth are set, you can start the test by
running _All-Tests-f640.bat. If your graphics card is too
slow, use _All-Tests-f640low.bat instead.
The whole test set takes no more than five minutes. Once it
finished, you can take the result file (gpubench_output-f640.csv
or gpubench_output-f640low.csv) and OpenGL Info file (gpubench.log)
and copy them somewhere else to prevent their overwriting by further
tests.
CSV files can be opened by almost any spreadsheet software from the
last two decades. Even good file managers are able to quickly view
them as a spreadsheet table.
Each row represents one test. The results are stored in the first
three columns (after the test name column). The program itself
calculates (pixel) ‘fillrate’ and ‘trianglerate’ values out of the
fps column based on how many pixels and triangles were drawn.
[pixel fill rate] (pixels/second) = fps * [pixels drawn per
triangle] * [number of triangles]
[triangle rate] (triangles/second) = fps * [number of
triangles]
Depending on the test, usually only one of these values is relevant.
How It Works
The default set of tests works in the double-buffered mode. So, the
program allocates two color buffers (front and back). This works the
way that a graphics card outputs content of the front buffer to a
monitor while a new frame is being rasterized in the back buffer.
After the rasterization is done, the card quickly copies the content
of the back buffer to the front buffer (“blitting”) and starts
working on a new frame.
Some of the early graphics cards are also able to do page flipping
where no data is copied between the two color buffers. After the
frame rasterization is completed, the graphics chip only changes
pointers defining which buffer is front and which is back (they are
switching their role after each frame). This technique is used only
when a 3D application is running in full-screen and leads to better
performance.
Higher resolutions require more space in video memory. In case of
640x480x16bpp (16 bits per pixel = 2 bytes per pixel), you need
1200kB just for the color buffers (2*640*480*2= 1,228,800B). In case
of 1024x768x32bpp, you need 6MB (2*1024*768*4=6,291,456B). The
application may refuse to start if the color buffer requirements
exceed available video memory.
Color buffers are not cleared after each frame in any of the default
tests. The process of buffer clearing decreases measured fill rate
by 10-15 % on cards from 1999 (e.g. NVIDIA Riva TNT2). Clearing of
the color buffers after each frame was usually performed in CAD/3D
applications where a drawn object didn’t cover the whole screen. On
the other side, games usually didn’t use this feature.
Tests with the _Z postfix are run with Z-Buffer (depth
buffer) enabled. The logic is set to do a LESS_OR_EQUAL test in the
Z-Buffer. That means that the graphics chip has to get the Z value
from the buffer, compare it with a currently processed pixel and
draw the new pixel (in both the color buffer and Z-Buffer) if and
only if its Z value is the same or lower. Depending on how a
pipeline and OpenGL driver is designed, this increases local memory
bandwidth demands.
Graphics drivers typically don’t care much about the Z-Buffer
precision set by a program. A typical driver behavior is to use a
16-bit Z-Buffer for 15/16-bit colors (32/65 thousands of colors) or
a 24-bit Z-Buffer (+ an 8-bit stencil buffer) for 32-bit colors (16
millions of colors). For example, a 16-bit Z-Buffer in 640x480x16bpp
requires additional 600kB of video memory (640*480*2= 614400B).
Together with two color buffers of the same size, this leaves you
only up to 248kB for textures on a graphics card with 2MB of memory.
Tests without the _Z postfix don’t use Z-Buffer at all.
Standard cards with unified memory will not allocate the memory
space for Z values, which leaves you more space for color buffers
and textures.
Fill rate
Computer games usually combine multiple effects on a screen. That’s
why the program measures fill rate for polygons with different
features enabled. The simplest drawing method (in OpenGL) is
rendering polygons that don’t have any texture and their color is
defined only by colors of their vertices (Gouraud shading). This
fill rate is typically limited by the frequency of a chip. If a chip
is running at 50MHz, its pixel fill rate for non-textured shaded
polygons will be up to 50Mpix/s (millions of pixels per second).
This applies to chips that can process such pixels in one cycle.
Increasing fill rate without increasing the chip clock requires to
implement more independent pixel-pipelines. A chip with two
pixel-pipelines is able to process two pixels per cycle (each
pipeline processes one per cycle) so the fill rate is effectively
doubled (up to 100Mpix/s for the 50-MHz chip).
A resolution of 640x480 is equal to 307200 pixels. With 30 frames
per second (fps), you need to draw 9216000 pixels per second, so the
required fill rate is 9,2Mpix/s. However, this is not so easy with
3D rendering.
Many early cards were not capable of rendering textured polygons as
fast as rendering polygons without textures. If a card needs two
cycles to render a single pixel on a textured polygon, the fill rate
is halved. The fill rate for textured pixels can go even lower if
the texture is large and a graphics chip must access its video
memory too often for new texels (= texture pixels). If the chip is
limited by the speed of video memory, disabling texture
(bilinear/trilinear) filtering can help a lot with large textures,
because then the chip needs to process just one texel for each
textured pixel (instead of four that are interpolated by bilinear
filtering).
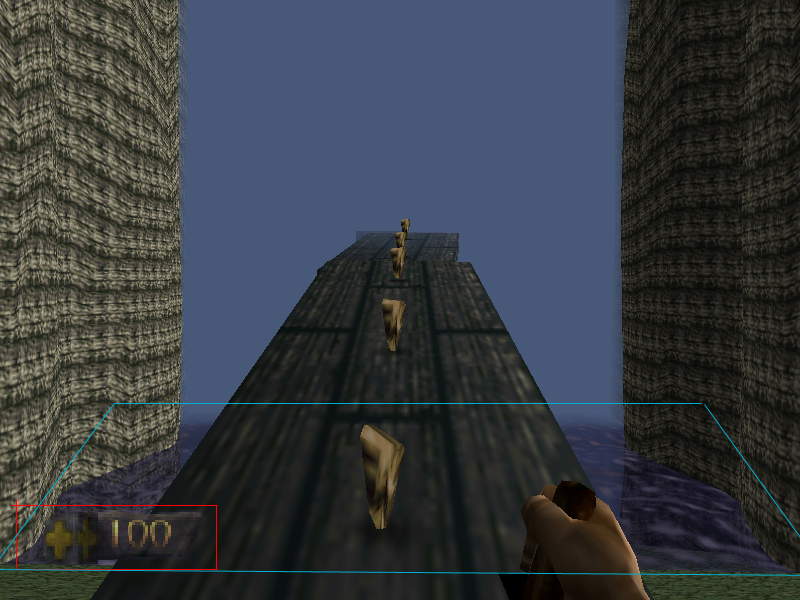
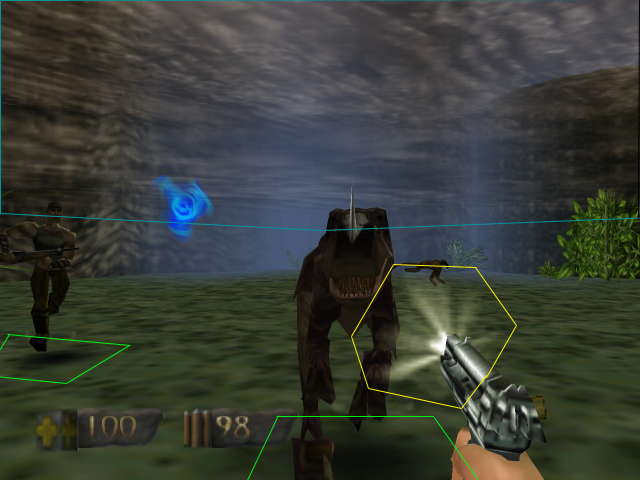
Additionally, not all pixels on the screen are rendered just once
per frame. See the screenshots from Turok:
Cyan: The water effect is added using a blending function
after the whole scene is rasterized. The blending allows to add
polygons which are partially transparent by combining a color of a
new (water) pixel with a color of a pixel that was already rendered
on the same position. Blending therefore requires additional reading
from the color buffer and can be slower than standard rendering of
non-transparent polygons (= fill rate is lower for blended
polygons). Even if blending operations don’t decrease the fill rate,
still all the pixels with water are processed twice so the effective
fill rate is halved for that part of the screen.
Red: (Alpha-) Blending is also used for on-screen elements.
One additional pass is required for the health indicator graphics
and then one additional pass is required for numbers.
Cyan: The bottom cloud layer is also partially transparent.
This means that the whole upper part of the screen takes twice as
much time to rasterize.
Additional effects are also done using blending effect (alpha – green,
additive – yellow).
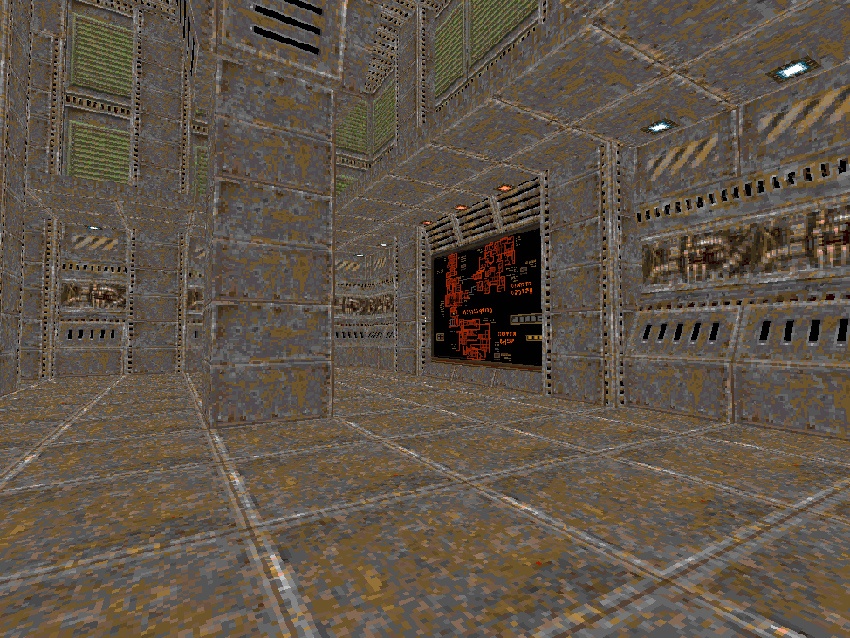
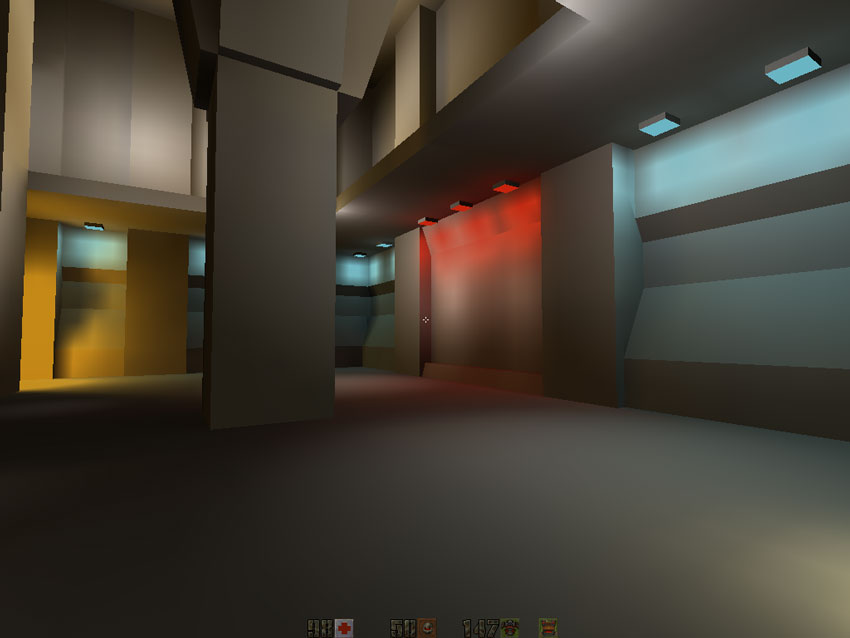
Light maps are just another style of rendering that requires
blending operations. You can create an illusion of lights and
shadows by adding blended polygons with precalculated light map
textures over polygons that have material textures on them.
Therefore, resulting pixels in the scene are a combination of the
material textures and the light maps. You can see material textures,
light maps and the combination on the screens from Quake II:
This technique requires to draw twice as much polygons and twice as
much pixels in the scene. Graphics chip manufacturers started to
implement multiple TMUs (texture mapping units) in their chips to
allow blending on two textures on a single polygon. Cards like 3Dfx
Voodoo2 with two independent TMUs (each with its own memory)
could render polygons with two textures as fast as polygon with just
a single texture. This is, however, true only in cases, where a
program/game uses an appropriate multitexture extension (GPUbench
can use only GL_ARB_multitexture, no vendor specific extensions were
implemented).
Test Description
Pixel_Fillrate – Tests how many pixels per second can
be drawn on Gouraud-shaded (and non-textured) polygons. The
created scene redraws each pixel multiple times per frame to
allow a card to show the peak values. This is achieved by
drawing multitude of polygons, each in different Z-distance,
thereby forcing the graphics card to redraw each pixel with each
new polygon. Even though most of them are not visible in the
completed frame, they always pass the Z-Buffer test so all of
them are processed by the graphics chip and written in video
memory.
Pixel_Blend_Fillrate – Tests how many pixels per second
can be drawn on alpha-blended Groudaud-shaded (non-textured)
polygons. Per-polygon blending increases video memory bandwidth
demands because the graphics chip must read a pixel from the
color buffer, blend it with a new one and then write the result
back. Blended polygons are used for effect such as water and
clouds.
Trianglerate – Tests how many polygons can be drawn per
second using Gouraud-shaded (non-textured) triangle strips.
Triangle strips are easier to process than independent triangles
because each new triangle in a triangle strip shares two
vertices with a previous triangle. Therefore, three vertices are
processed only in case of the first triangle. Every other
triangle adds just one vertex to process. On large scale, you
can decrease vertex processing demands by three in comparison
with independent triangles. Triangle strips were often used for
terrain models.
Trianglerate_NoStrip – Tests how many polygons per
second can be drawn using Gouraud-shaded (non-textured)
independent triangles. This means that all three vertices must
be calculated for each triangle. Independent triangles are used
everywhere where it would be difficult to form all triangles in
triangle strips.
Tx_Trianglerate_NoStrip – Tests how many polygons can
be drawn per second using textured Gouraud-shaded independent
triangles. Texture is mapped in a way that is not friendly to
texture caches on early graphics cards because the
pixel-to-texel ratio is way below 1. This type of texturing was
used in certain old CAD software packages.
Tx_Pixel_Fillrate – Tests how many pixels per second
can be drawn on textured Gouraud-shaded polygons. The
pixel-to-texel is ~1.2 in 640x480 (almost each pixel has a
different texel).
Tx_Pixel_Blend_Fillrate - Tests how many pixels per
second can be drawn on alpha-blended textured Gouraud-shaded
polygons.
Multi-Tx_Pixel_Fillrate – Adds second texture to the
the Tx_Pixel_Fillrate test. Similar way is used for rendering
textured objects with light maps. This approach allows you to
have polygons with materials (the first texture), precalculated
static light (the second texture) and simple dynamic lights
(vertex coloring using Gouraud-shading). The test uses
multi-texturing capabilities of a chip (GL_ARB_multitexture). If
multi-texturing is not available, the program fails back to
multi-pass rendering where each multi-textured polygon is
replaced with two single-textured polygons (the second one is
alpha-blended). Unlike early Quake engine-based games, both
textures are always 24bit which makes the test more memory
bandwidth demanding (older games often used 4/8-bit palletized
textures to overcome slow video memory access).
Multi-Tx_Pixel_Fillrate_multipass – Simulates
multi-texturing using multi-pass rendering. It allows you to
measure the performance benefit of using multi-texturing
extensions. Even if a card has support for multi-texturing, the
performance might not be significantly higher in comparison with
multi-pass rendering – typically with cards that have two
pixel-pipelines, each with one TMU (texture mapping unit), that
renders multi-textured polygons by borrowing a TMU from the
second pixel-pipeline (which would be disabled during this
operation). If your card does not support multi-texturing using
GL_ARB_multitexture, this test should give you the same result
as Multi-Tx_Pixel_Fillrate.
Tx_Pixel_Fillrate_No_Color – Modifies the
Tx_Pixel_Fillrate test by setting all vertex colors to white
(1,1,1). This allows you to see if the OpenGL driver can bypass
the vertex coloring procedure (= texture value * pixel color) to
increase performance. OpenGL does not allow a programmer to
disable the vertex coloring (unlike early Direct3D) although it
would speed up rendering on early consumer 3D accelerators.
Unfortunately, I didn’t find any driver (/card) that would
understand this specific situation in OpenGL.
Tx_Pixel_Fillrate_No_Filtering – Modifies the
Tx_Pixel_Fillrate test by disabling bilinear filtering. The chip
can then process a textured pixel by reading only one texel
instead of four (required by interpolation mechanisms of
bilinear filter).
Tx_Pixel_Blend_Fillrate_No_Filtering - Modifies the
Tx_Pixel_Blend_Fillrate test (with alpha-blended polygons) by
disabling bilinear filtering.
Lowres_Tx_Pixel_Fillrate / Lowres_Tx_Pixel_Fillrate_No_Filtering
– Repeats Tx_Pixel_Fillrate and Tx_Pixel_Fillrate_No_Filtering
with a smaller texture (32x32 instead of 256x256), which
significantly increases pixel-to-texel ratio (10x10px per texel)
and leads to a better performance.
Driver_overhead_Trianglerate – Renders large number of
(100px) triangles that are handled as independent objects (each
can be positioned, scaled and rotated independently). This means
that each triangle is handled in a different draw call, so the
test is limited by CPU/driver overhead and the way how the
command buffer is handled.